Dashboard & Widgets
Two levels of personalization: a daily home screen with operational widgets and configurable analytical dashboards with charts, tables and burndown.
Landing page after login
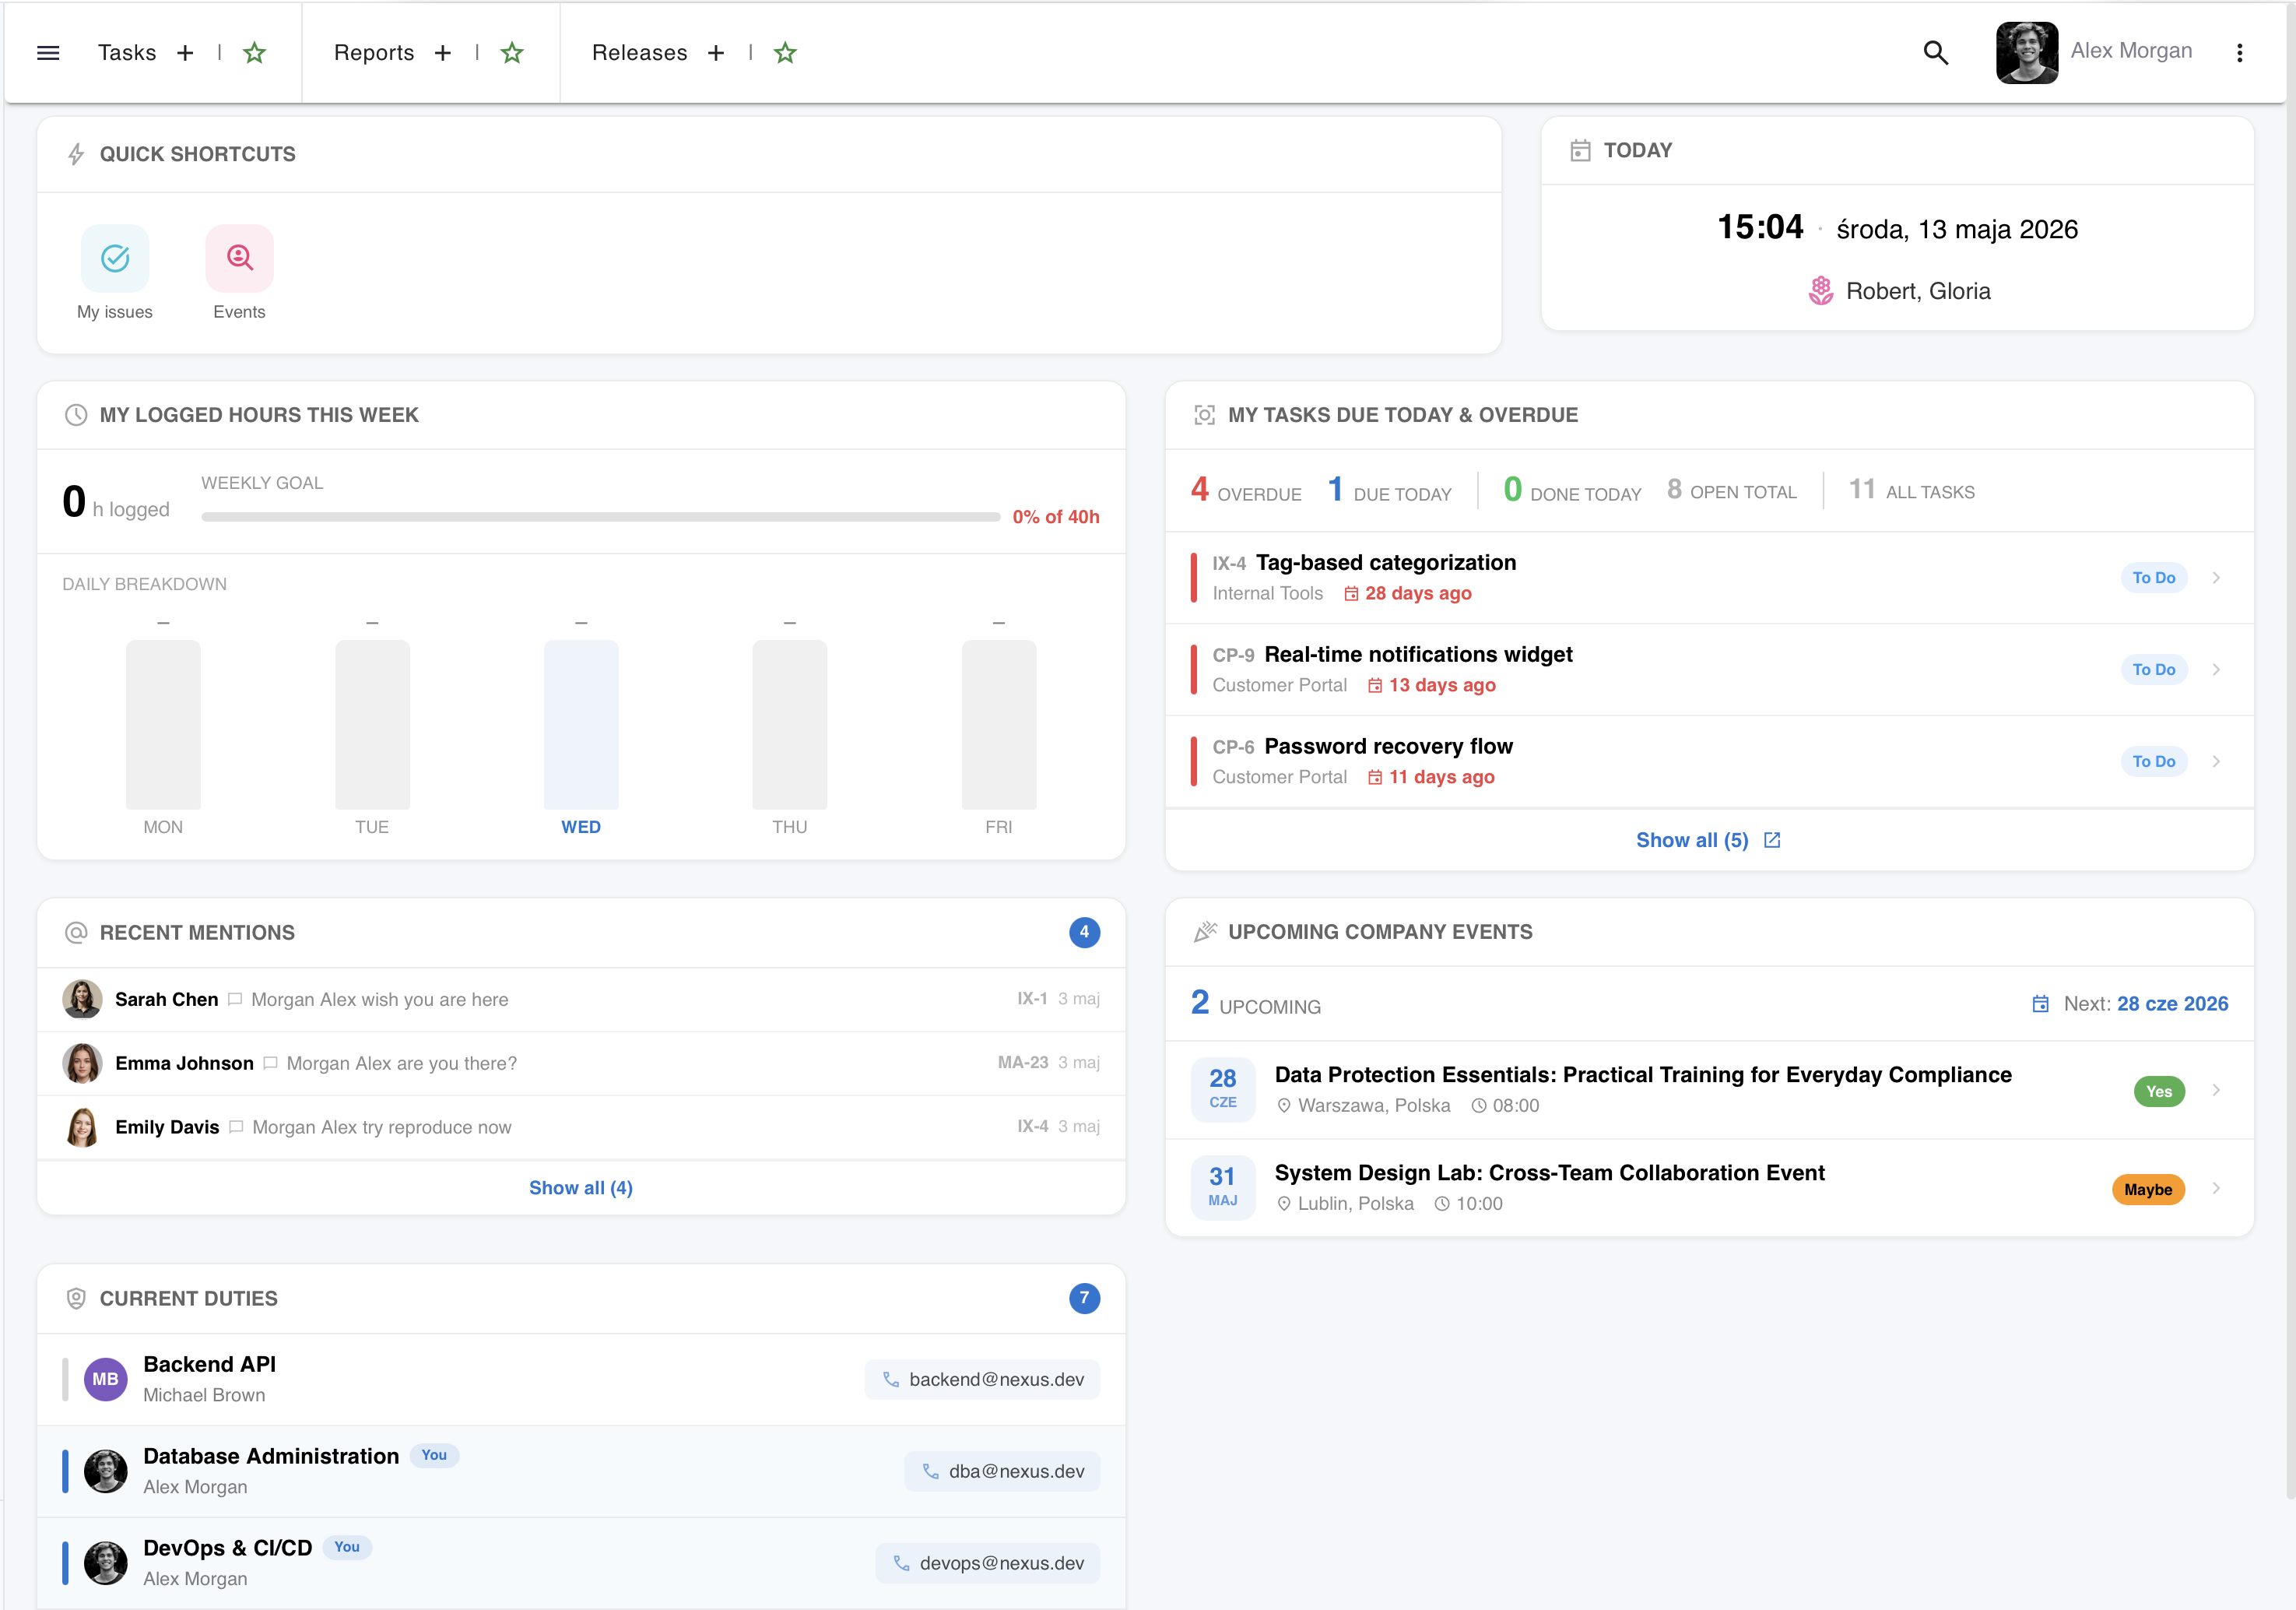
The first screen every user sees — a set of widgets summarizing the current day, tasks and team activity.
Home Screen is based on a CMS-based page system — the administrator defines the widget layout, and each user personalizes the visibility and order of elements on their dashboard:
- "Today" Widget — date, greeting and quick day overview: upcoming meetings, task deadlines, current on-call shifts
- My Focus — list of tasks assigned to the logged-in user grouped by status; quick access to the most important tasks
- My Week — weekly view with planned tasks and deadlines; workload overview for the coming days
- My Mentions — aggregation of all user @mentions from comments, tasks and descriptions — nothing gets missed
- Company Calendar — upcoming company events: meetings, team-building, training
- Current On-Call — who is on call today, in which team and when the shift ends
- Shortcuts — configurable quick links to the most frequently used views and features
- Project Cards — thumbnails of active projects with a quick overview of task statuses and a button to create a new task
Everyone sees what they need
Widget visibility and order on the home screen is fully configurable by every user.
Hiding Widgets
Any widget can be hidden with one click. Hidden elements don't take up screen space but remain available for re-enabling in the personalization panel.
Reordering
Widget order on the home page can be freely rearranged — the most important elements go to the top, less used ones lower. Order is remembered per user.
HTML Widgets
Administrators can add custom HTML widgets — from simple announcements and banners to interactive elements embedded in code. Ideal for internal communication and quick updates.
Quick Menu Groups
Configurable groups of quick access links — shortcuts to frequently used views, projects, reports or external pages. Centrally defined by the administrator, visible to selected roles.
Configurable dashboards with widgets
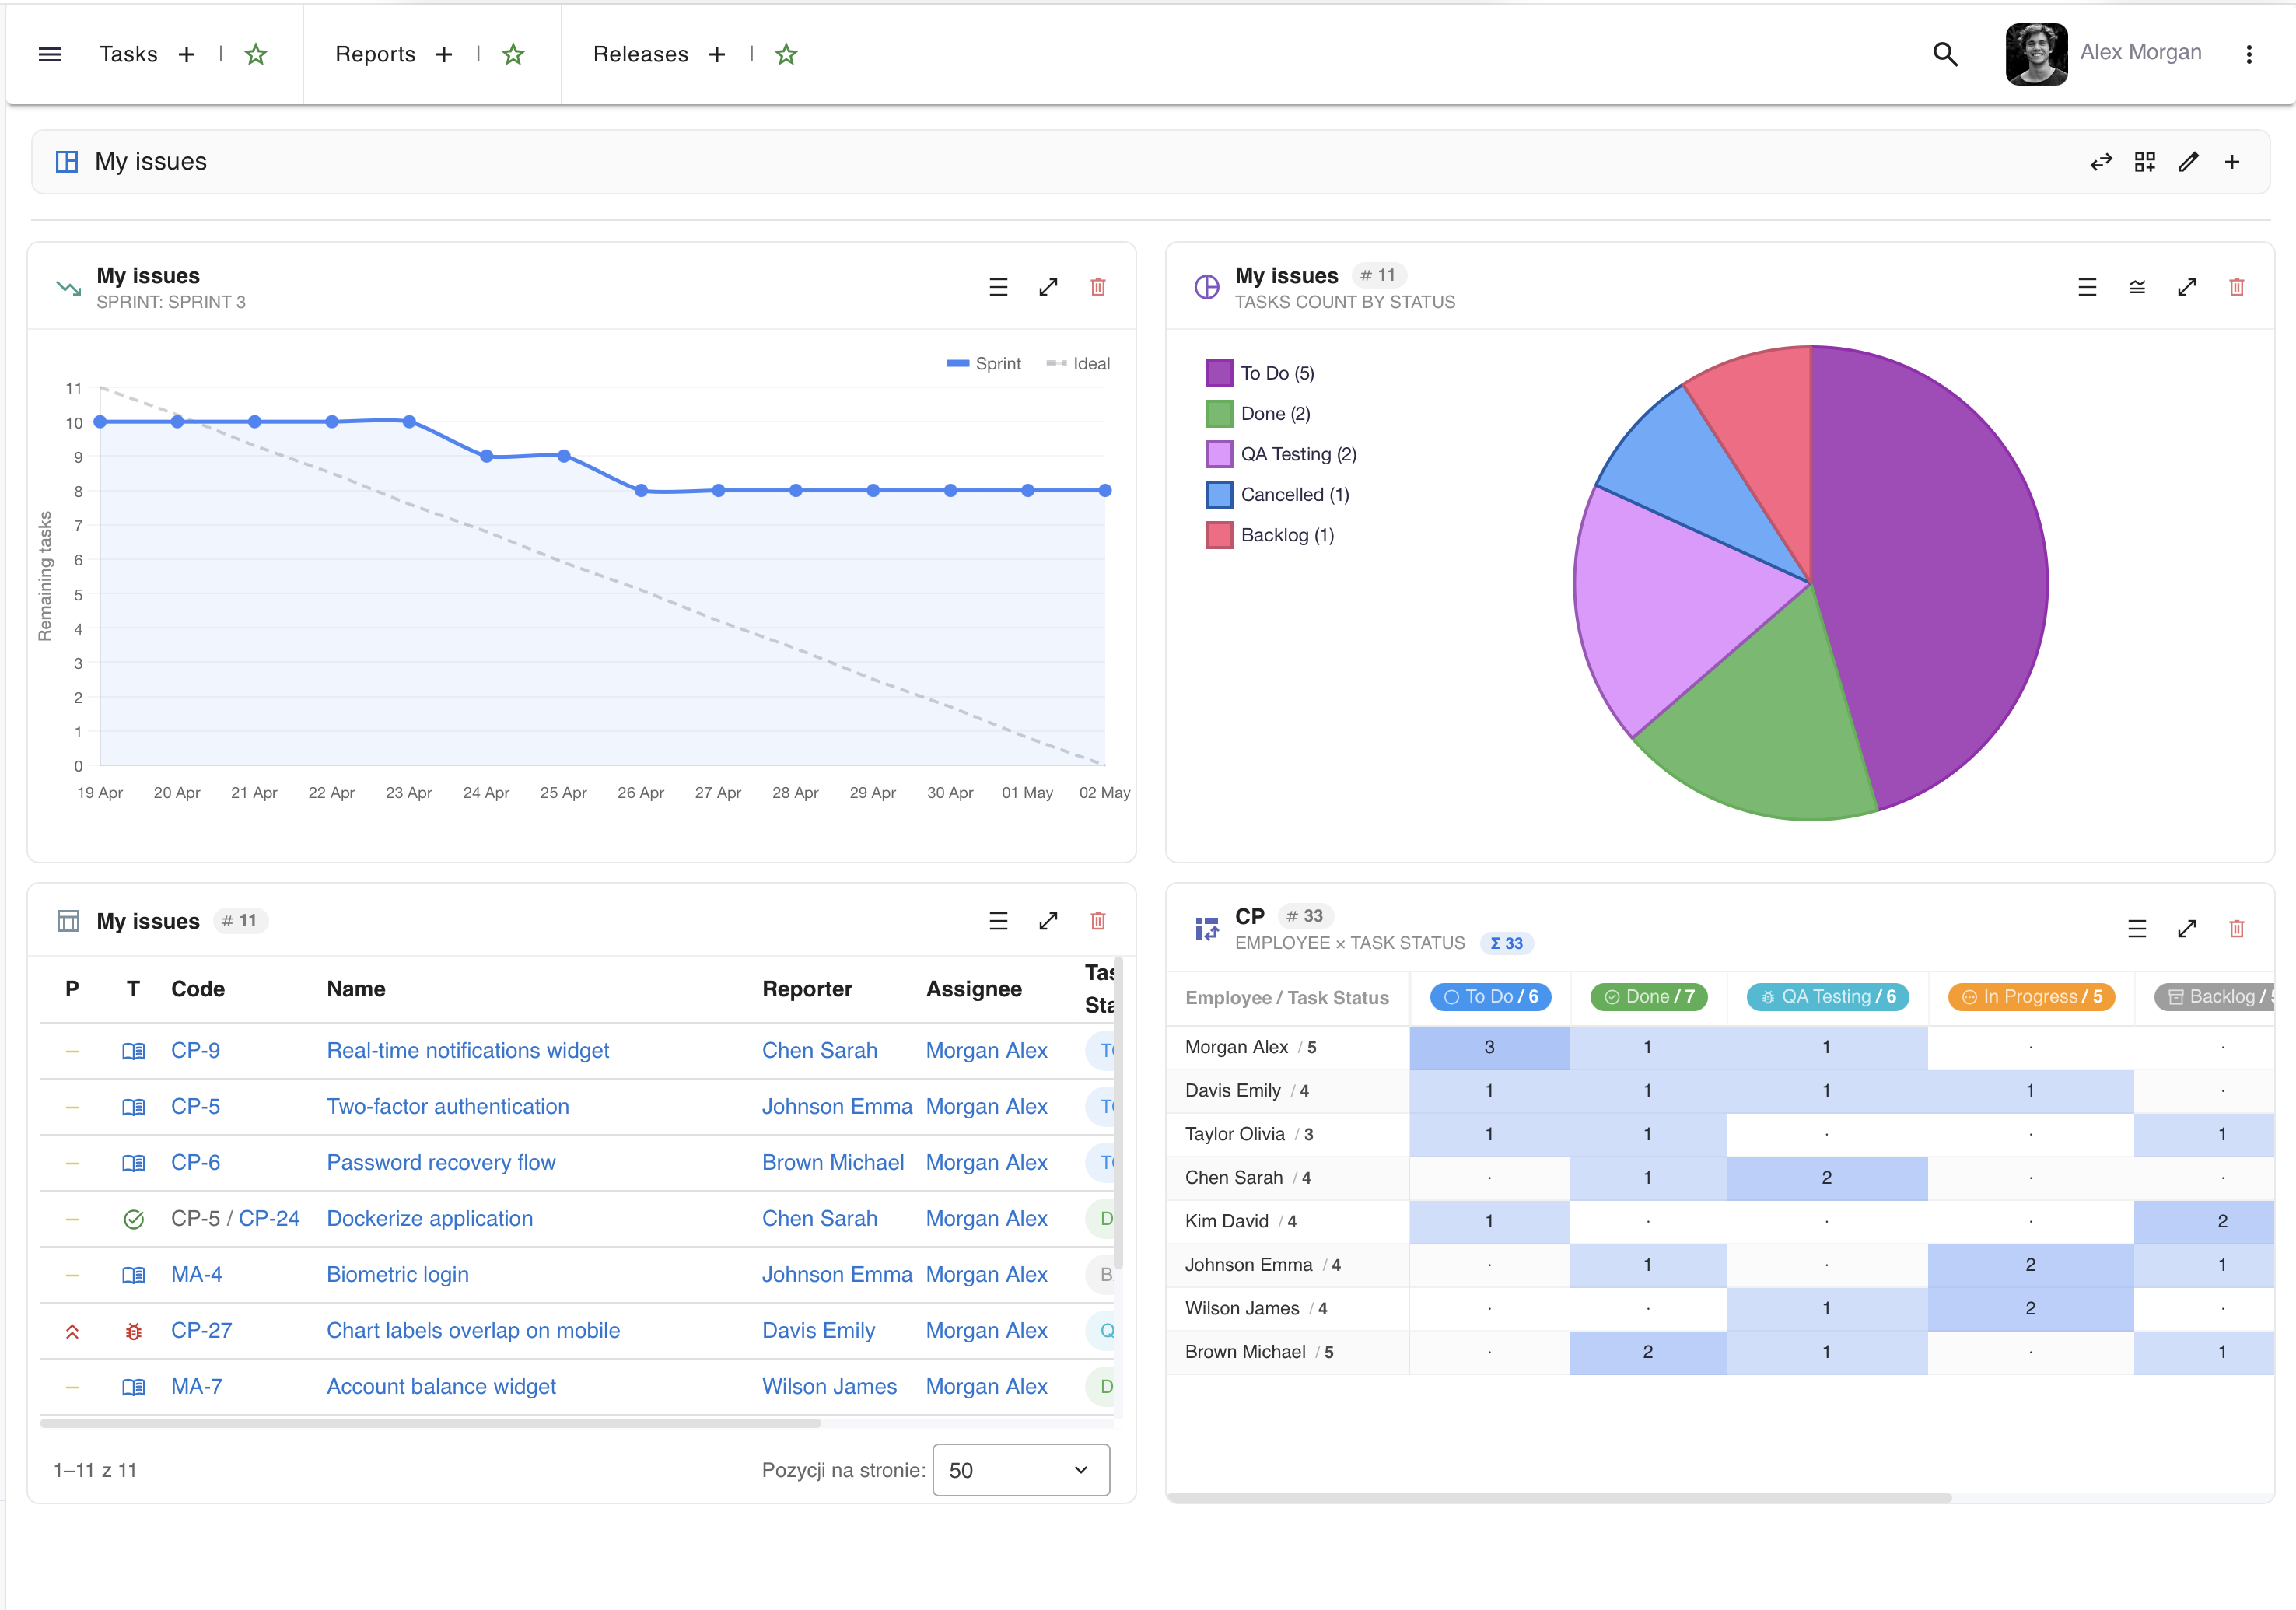
A separate dashboard module allows building advanced analytical panels with charts, tables and statistics based on saved filters.
Analytical Dashboards is a separate module from the home screen. Each user creates any number of dashboards with different layouts and widget sets:
- Multiple dashboards — e.g. one for project tasks, another for team statistics; switching from a single selector
- 99 grid layouts — from full width, through 2/3 columns, to 2×2, 3×2 grids and hybrid layouts (1+2, 2+1)
- Filters as data source — each widget is linked to a saved filter from the search screen; changing the filter = changing the data
- On-the-fly filter change — the filter icon in the card header allows changing the data source without rebuilding the widget
Seven widget types
From simple tables to advanced burndown charts and pivot tables with drill-down.
Task Table
A table widget with saved column view (from the table configuration module). Compact view with sorting, task links and status chips. Expandable to full screen for comfortable browsing.
Bar Chart
Task distribution by selected statistical dimension — e.g. number of tasks per status, priority or type. Configurable legend, tooltips with values and responsive scaling.
Doughnut Chart
Proportional data distribution with a cut-out center. Legend with labels and values on the left, tooltips on hover. Configurable legend — can be hidden to give the chart more space.
Pie Chart
Full version of the proportional chart — without the center cut-out. Same data and configuration options as the doughnut variant. Choice between doughnut and pie depends on the user's visual preference.
Numeric Statistics
Large summary number with breakdown by components — e.g. "156 tasks" split: 42 In Progress, 38 To Do, 76 Done. Color-coded highlighting of each category. Ideal for a quick project overview.
Pivot Table
Matrix crossing two task attributes — e.g. status × priority. Color intensity heat map, row and column totals, grand total. Clicking a cell opens a drill-down with a list of specific tasks.
Burndown Chart
Two variants: sprint burndown i release burndown. Progress line vs ideal line, tooltip with remaining task count, automatic Y-axis scaling. Color distinguishes sprint (blue) from release (purple).
Edit mode and personalization
Every dashboard can be customized in edit mode — from swapping widget positions to changing their size.
Drag & drop positions
In edit mode, widgets gain a drag handle. Swapping positions of two widgets is instant and automatically saved to the server.
Card Size
Three height presets (S / M / L) available with one click. For more precise control — manual scaling by dragging the bottom edge. Size remembered per widget.
Fullscreen View
The expand icon opens the widget in a dialog taking up 95% of the screen. Tables get more rows, charts scale to full height, and pivots show the complete matrix.
Layout Change
The grid layout of an existing dashboard can be changed at any time. If the new layout has fewer slots than the previous one, excess widgets are automatically removed with confirmation.
Want to see more?
A meeting is the fastest way to see how say.work can streamline your team's work.
calendar_month Book a demo